
 Natural Sciences
Big Questions, Big Data, Big Challenges to Today’s Technology
 Twitter
 Facebook
 Forward
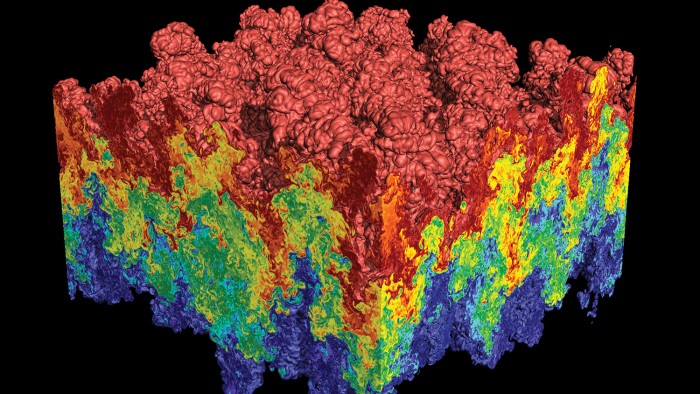
Illustrating how heavy and light fluids mix requires processing massive amounts of information and displaying the results visually. This is a well-known visualization of a Rayleigh-Taylor instability, created by Hank Childs during his time as a computer scientist at Lawrence Livermore National Laboratory in California. It shows the instability at the mixing interface of a dense fluid, such as water, and a lighter one, such as oil.
When an explosion at the Deepwater Horizon oil rig in April 2010 caused crude oil to begin spewing into the Gulf of Mexico at the rate of more than 50,000 barrels per day, scientists faced a monstrous, two-headed question: Where will the oil go? And how do we process all the data needed to answer that and respond?
It was a real-life problem that tapped into big data—data sets so large and complex that they overwhelm conventional computers, presenting hurdles in processing and visualizing information.
Enter Hank Childs, who lives at the crossroads of big data and visualization.
Childs, one of the newest faculty members in the Department of Computer and Information Science, studies supercomputers and the challenges of presenting their results visually. It’s anything but a theoretical exercise: As technology advances, it will soon be necessary to handle exabytes of data, each one of which is equal to one quintillion bytes.
The first challenge is trying to process these large data sets. The second is to produce meaningful results—how do we display an exabyte of data? The billions of bytes of information involved in big data problems must be dramatically scaled down to be displayed within the limits of today’s technology.
“You only have about a million pixels on the computer screen,” Childs said. “For an exabyte, you have to do a billion-to-one reduction of which data points make it onto the screen.”
UO departments such as geography have incorporated big data for decades and now Childs’ arrival underscores the university’s commitment to expanding the analysis and application of these large data sets.
In a recent presentation to UO officials, physics professor Greg Bothun said big data will be a guiding theme for research universities over the next several decades, and many are updating infrastructure accordingly. The UO, for example, plans to develop a system that will display fifty million independent pixels—about fifty times what is commonly used.
“Big data creates opportunities to tackle problems in a fundamentally different way, which may be highly relevant to the world we live in,” Bothun said. “We can begin to play in this arena because of some key hires and machine hardware.”
The university recently hired alum Kristi Potter (’00, computer and information science), a frequent collaborator with Childs, as a specialist who will work with faculty members to display big data results visually. Childs, meanwhile, was called by Bothun “one of the best and most experienced scientific visualization programmers in the world.”
While working for the California-based Lawrence Livermore National Laboratory in 2000, Childs and a team of programmers created a visualization and analysis tool that can run information-heavy simulations and produce comprehensible results without the need to transfer data between a series of desktop computers. They called it VisIt and made it available to the public; it’s since been downloaded more than 200,000 times.
VisIt played a key role in developing a better understanding of oil movement in the Gulf. The initial predictions for oil movement were off. Scientists realized that they needed to account for a multitude of variables in real time, including atmospheric and surface ocean currents, water temperature differences and more. VisIt enabled them to understand the simulations necessary to accurately predict oil dispersion.
“VisIt serves as a hub to deliver cutting-edge techniques,” Childs said. “In this case, we developed a visualization technique for the nuclear fusion community that ended up being really useful for oceanographers. In the bigger picture, we have developed an infrastructure for handling some of the largest data sets in the world, and it is really exciting to see it be deployed to areas like climate, combustion, astrophysics and many more.”
— Matt Cooper