
Mapping Out a Career
 Twitter
 Facebook
 Forward
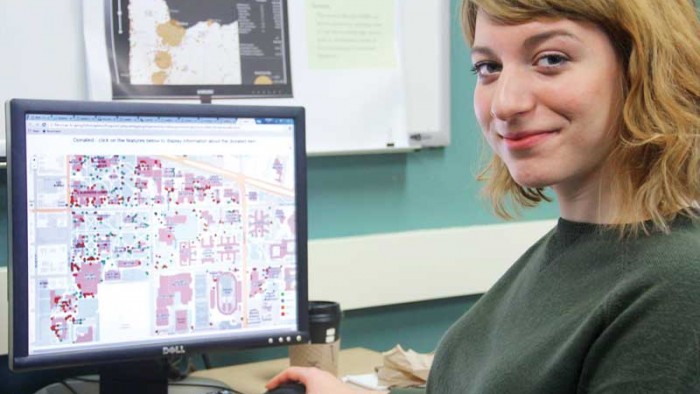
If you major in geography, you are likely to get this reaction at some point during your education:
“Oh, you’re into geography? You must be good with state capitals.”
Senior Julie Stringham (above) rolled her eyes. She’s had more than one opportunity to field this. “I tell them, ‘I’m a data scientist,’” Stringham said. “‘Spatial stuff is what I’m into.’”
“Spatial stuff”—or geospatial information—is any data that describes the location and names of features beneath, on, or above the earth’s surface.
It’s the bread and butter of the InfoGraphics Lab. In this nationally recognized arm of the geography department, promising students such as Stringham work with professionals on actual geospatial mapping projects for clients—and gain marketable skills while they’re at it.
On a recent Friday morning, Stringham sat at a desk facing two computer monitors. On the right one was a digital map of campus with small flags showing the location of commemorative trees, plaques, benches, and art. On the left one, line upon line of computer coding—basically, instructions a computer followed to build the map.
Stringham decided to change the color of the art flags, which were turquoise. With a couple keystrokes, she entered the value for the color red—#de2d26—on a line in the coding on the left monitor and, just like that, the flags turned red on the map to her right.
It was a simple task, but that’s the point: computer programming skills are becoming imperative for working with the latest mapping software and geospatial data, because changes can be made with the press of a button.
Historically, if changes were necessary for Stringham’s online map—say, a new tree had been planted somewhere on campus—she would have had to take the time to electronically draw the feature, taking care to find the precise spot at which to locate the new tree.
But Stringham’s mapping application was drawing its information from the department’s database, which keeps the latest data on the location of commemorative trees. To relocate a tree’s position on her map, she would need only to change that value in her mapping program, and the tree would appear in the proper spot on her map.
“We have two data sources happening here,” Stringham said. “We’re drawing data from our database—those are the features on the map. And the rest”—that is, the map itself—“draws from a web-based data source that hosts the map.”
For this map application, Stringham used a computer-programming language called Javascript, a digital mapmaking tool called Leaflet and a mapping data source developed by the lab’s Campus GIS and Mapping Program.
But if Ken Kato has anything to say about it, with the next assignment Stringham will use yet another programming language and another mapping application. And so on, with each new project.
Given the ever-expanding landscape of new GIS tools and methods, Kato, the lab’s associate director and director of the mapping program, emphasizes the value in practicing new approaches for solving the same problems.
“The more tools they can bring to bear, the better,” Kato said. “We want Julie and others to get the same experience in solving a campus problem that an employer would ask. We’re not trying to teach you how to use a mapping application—we’re trying to teach you how to make one.”
For a capable student such as Stringham, the goal could be building an advanced mapping tool such as Mongoose. The lab built the mapping application for the university’s incident-management team, which wanted a way to share the status of issues during events such as home football games and the 2012 Olympic Team Trials in track and field.
Drawing from a variety of spatial data sources maintained by the mapping program, Mongoose enables safety officials to communicate and share critical information during an event. Using an iPad, for example, an official could place a flag on a digital map of Autzen Stadium to show the location of a burst water pipe during a football game; the flag would pop up on the screens of other officials using the map, and all communications tied to resolving the issue would be attached to that flag.
As geospatial technologies continue to evolve, the ability of geographers to solve problems such as this one will be bound only by their proficiency with the latest mapping tools.
“Mongoose exemplifies the ability to deviate from the methods and software we’ve used in the past to come up with new ways of carrying out a task,” Stringham said. “I’m excited to become more familiar with this process.”
—Matt Cooper