
Enter Destination: Apple
 Twitter
 Facebook
 Forward
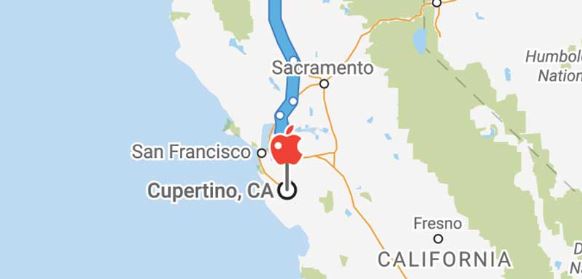
Early in his four years at the University of Oregon, as Neal Horner began to contemplate careers, his dad mentioned an emerging field—geographic information systems, or GIS—as an opportunity his son might want to consider.
They didn’t speak in any detail about mapping services like Google Maps or in-car navigation devices or any other type of well-known GIS application. It was just a tip, father to son. But that was enough.
Horner, a geography major, started poking around. “Emerging field” scarcely captured it. GIS seemed to have an integral role in a vast range of potential professions: archeology, city planning, environmental monitoring, forestry, homeland security, law enforcement, health and human services, real estate. Public sector, private sector, profit, nonprofit—thousands of jobs in almost every field imaginable had some sort of need for location-based data.
Horner was sold. He started loading up on classes that would eventually earn him a specialization in GIS to augment his geography degree. He knew he liked computers. He knew GIS would dovetail nicely with his interests in land management and the environment. And he knew there were good GIS jobs out there.
But he didn’t imagine that he would step, straight from graduation in June 2015, into an opportunity with one of the most innovative employers in the world: Apple Computer. Nor did he imagine that the Cupertino, California-based tech giant would also scoop up four of his classmates from the UO GIS program, in the span of a year.
Neal Horner, ’15, found that thousands of jobs in almost every field imaginable—public sector, private sector, profit, non-profit—had some need for location-based data.
Sworn to Secrecy
Horner, along with Adam Oldenkamp, Riley Champine, Carolyn Gilchriese, and Emily Nyholm, are now a cohort of five newly minted Ducks, living under one roof in suburban Silicon Valley, pinching themselves each day they go to work and geeking out each night at home, trading the latest hot examples of digital mapping.
Today, they are all GIS technicians for Apple—Nyholm, BS ’14, is a full-fledged employee and the other four, all 2015 graduates, are under contract with the opportunity to follow in her footsteps.
Apple, being Apple, has sworn them to secrecy about their work, so none of them are free to discuss the exact nature of their employment. But what they can talk about, in detail and with much enthusiasm, is how their GIS training at the UO—in the classroom and in the renowned InfoGraphics Lab—prepared them to land jobs immediately after graduation with a Fortune 5 technology leader.
The UO Department of Geography—ranked among the 10 best nationwide—offers geographic information science as a distinct track, on equal footing with traditional specializations such as physical geography. In the GIS track, students get both mapping and data-analysis skills through a twin-pronged education that prioritizes both the classroom and the laboratory, both learning and doing.
(Meet the professors who make geospatial technology come to life for students.)
“The geography curriculum set me up for success in the lab, which set me up for landing this position,” Riley Champine said. “I had no inclination to do geography—I didn’t know what geography was as a discipline until I took a GIS class the spring term of my freshman year.
“Now I realize some of my first geography professors were just really passionate about what they did,” he added. “I fed on that energy and it drew me into the major.”

Carolyn Gilchriese, ’15. “It’s very hands-on. Doing things like that in a classroom creates a passion in the student to move forward.”
A Different Way to Look at Data
The GIS field breaks out into two areas: data analysis and mapping.
At a minimum, this means working in the two dimensions of latitude and longitude, or X and Y coordinates. Then there are the endless ways to assess any given spot: weather conditions, food supply, income levels, soil composition, traffic patterns, cancer rates, population figures, and a hundred other variables, a list limited only by the reach of technology and one’s imagination. As a result, GIS sometimes means working in three dimensions, professors say. Sometimes four.
Carolyn Gilchriese still remembers her first reaction to the oceans of data used in GIS: wow.
For Gilchriese, interest in the field built as she was taught how to manage huge data sets and present the results in a clear, attractive manner. Even at the introductory level, she learned to map an area and assign values to, say, a vineyard, identifying the best spots for growing grapes based on pH levels, soil density, and microclimate.
“I was blown away—‘Wow, we can do all these things,’” Gilchriese said. “It was a different way to look at data—instead of Excel and bar graphs, it was very spatial and visual. It’s very hands-on, working with these (GIS software) programs. Doing things like that in a classroom creates a passion in the student to move forward.”

Adam Oldenkamp, ’15. “How do I highlight what’s important, how do I stay fair to the data, what story am I telling, and how do I present that in a visually effective manner?”
The Bigger the Better
In upper-level courses, students learn the latest tools and techniques for finding relevant information themselves, cleaning it up, analyzing it, and drawing meaningful conclusions. That’s where Adam Oldenkamp began using GIS to solve problems.
He acquired a skill called “scripting”—issuing commands in a computer language that directs a “script” or program to run tasks that would otherwise be done (much more laboriously) by a human. The popular scripting language Python, for example, can be used with ArcGIS, a geographic information system that creates and uses maps, compiles geographic data, and analyzes mapped information.
Said Oldenkamp: “You can take huge quantities of data, run complicated formulas on it, and come up with this elaborate visualization that, had you done it without any aid, would have taken a really long time.”
It starts with collection: upper-level students are taught how to tap information repositories run by governments and other entities where computer programs and the codes that run them are free and available to the public.
Students are trained to work with big data sets, Oldenkamp said—the bigger the better. With scripting, he was able to electronically sift through massive data banks on topics such as climate or census figures, posing questions, finding patterns, and drawing conclusions.
The process ends with what Oldenkamp calls “the aesthetic”—presenting results in an appealing way, through maps and infographics.
“It’s ‘how do I highlight what’s important, how do I stay fair to the data, what story am I telling, and how do I present that in a visually effective manner?’” Oldenkamp said. “There is a panoply of skill sets, any one of which could become a career opportunity after graduation.”

Riley Champine, ’15. “That’s where the geography department succeeded for me—it made me obsessed with the details.”
It’s All About Depth
Much of the geography department’s approach to teaching GIS is about breadth—for instance, giving students a taste of the ever-growing array of software tools used to crunch data and present it visually.
But when it comes to mapmaking, Riley Champine can tell you, it’s all about depth.
The upper-level advanced cartography course, for example, starts with map design and production methods, then moves into use of color, cartographic visualization, graphing, and data graphics theory. It culminates with the integration of GIS and graphics tools.
At its heart, the course asks of students what Champine called a “deep academic question”: can you develop a data-driven map from scratch, moving it from an original idea to a finished product?
“The vast majority of the course was dedicated to that single project, with the expectation that the map you’re going to create—and you’re getting graded on—is going to be the most aesthetically pleasing map,” Champine said. “It’s seven weeks not just of point-and-click, but thoughtful development into making the best design possible.”
In his project for the class, Champine, a soccer fan, told the story of professional soccer in America. He charted the league’s growth in attendance and mapped each team’s location, market reach, attendance, and facilities. The map took first place in a nationwide contest run by National Geographic.
The gift of the course, Champine said, is that it makes students as detail-driven as any working cartographer.
“To really excel in that class, you’re delving into the details so much, you’re obsessing about what the font is going to be and what color the background is going to be and you change it 600 times before you’re satisfied,” Champine said.
“In print cartography, that’s what people do. You have to be obsessed with it,” he added. “And that’s where the geography department succeeded for me—it made me obsessed with it.”
Emily Nyholm, ’14. “There are so many variables in GIS. You have to ask the right questions to make sure you get the right answer, the right priority.”
Working with Clients
The UO InfoGraphics Lab is a special-projects lab inside the Department of Geography. It pairs students and professional staff to complete real-world projects for UO faculty, campus offices, and outside government agencies. Projects range from the creation of regional atlases to the development of iPhone mapping applications; all of them share the focus on integrating GIS and graphic-design tools with cartography.
For Emily Nyholm and her four fellow alumni now at Apple, there’s no way to overstate the role the lab played in where they are today. Simply put, the lab gives students experience working with clients.
Nyholm—along with Champine—participated in an innovative, data-rich project with the University of Wyoming to produce an atlas for the migratory patterns of that state’s hooved animals.
Scheduled for release in 2017, the Atlas of Wildlife Migration: Wyoming’s Ungulates will cover more than 70 migration topics, ranging from ecology to conservation and management, illustrated with maps, graphics, and photographs. It will serve as an authoritative reference book, and migration stories in the atlas will be accessible online in an interactive format, with animations, interviews, and other links.
As student cartographers working with the professional team under James Meacham, executive director of the InfoGraphics Lab, Nyholm and Champine designed and laid out pages, including maps, charts, and graphs. With a wealth of data at their fingertips—some of it geospatial, some of it specific to mule deer and other animals—the two had the daunting but rewarding opportunity to help decide how to tell the story of the animals’ amazing cross-state journeys.
A Powerful Portfolio
“That was really exciting—it’s like, ‘All right, we want to do a page on bison, so what kind of story in these two pages do we want to tell?’” Nyholm said. “‘What is their lifecycle, their migration pattern?’ It was really interesting to say, ‘Here’s one topic and all of these different things that we can look at using spatial data—can we answer multiple questions
in one chart?’”
On one level, the benefit to Nyholm was tangible—the pages she helped design became her portfolio. That proved to be a valuable and uncommon asset during job interviews, given many college graduates seeking their first job haven’t yet established a body of work.
Perhaps more important, though, Nyholm experienced GIS in practice with an actual client, contributed to a major project, and adhered to a work schedule for meeting a series of deadlines. She saw firsthand how GIS professionals organize a job, divide duties, and work closely with clients to sharpen the focus of an undertaking into an achievable product.
“It helped me a lot to figure out—when I’m working with other people—that I need to ask the right questions,” Nyholm said. “You need to be able to communicate really, really well: ‘I need more information to make sure I understand what you’re expecting.’”
“There are so many variables in GIS,” she added. “You have to ask the right questions to make sure you get the right answer, the right priority.”
Adaptability is the currency of GIS, according to Chris Bone, assistant professor of geography and a GIS specialist. It’s a skill he saw these five students hone in class and in the lab.
“Most important is this idea of ‘spatial thinking,’” Bone said. “Given a problem, they know the type of data they need to collect and a suite of analytical methods that can be applied to generate solutions. Essentially, they’re becoming the problem-solvers in GIS environments.”
—Matt Cooper