
 Social Sciences
The Beautiful Game
 Twitter
 Facebook
 Forward
Riley Champine had no trouble at all coming up with a subject for his project in an upper-level mapping class: soccer.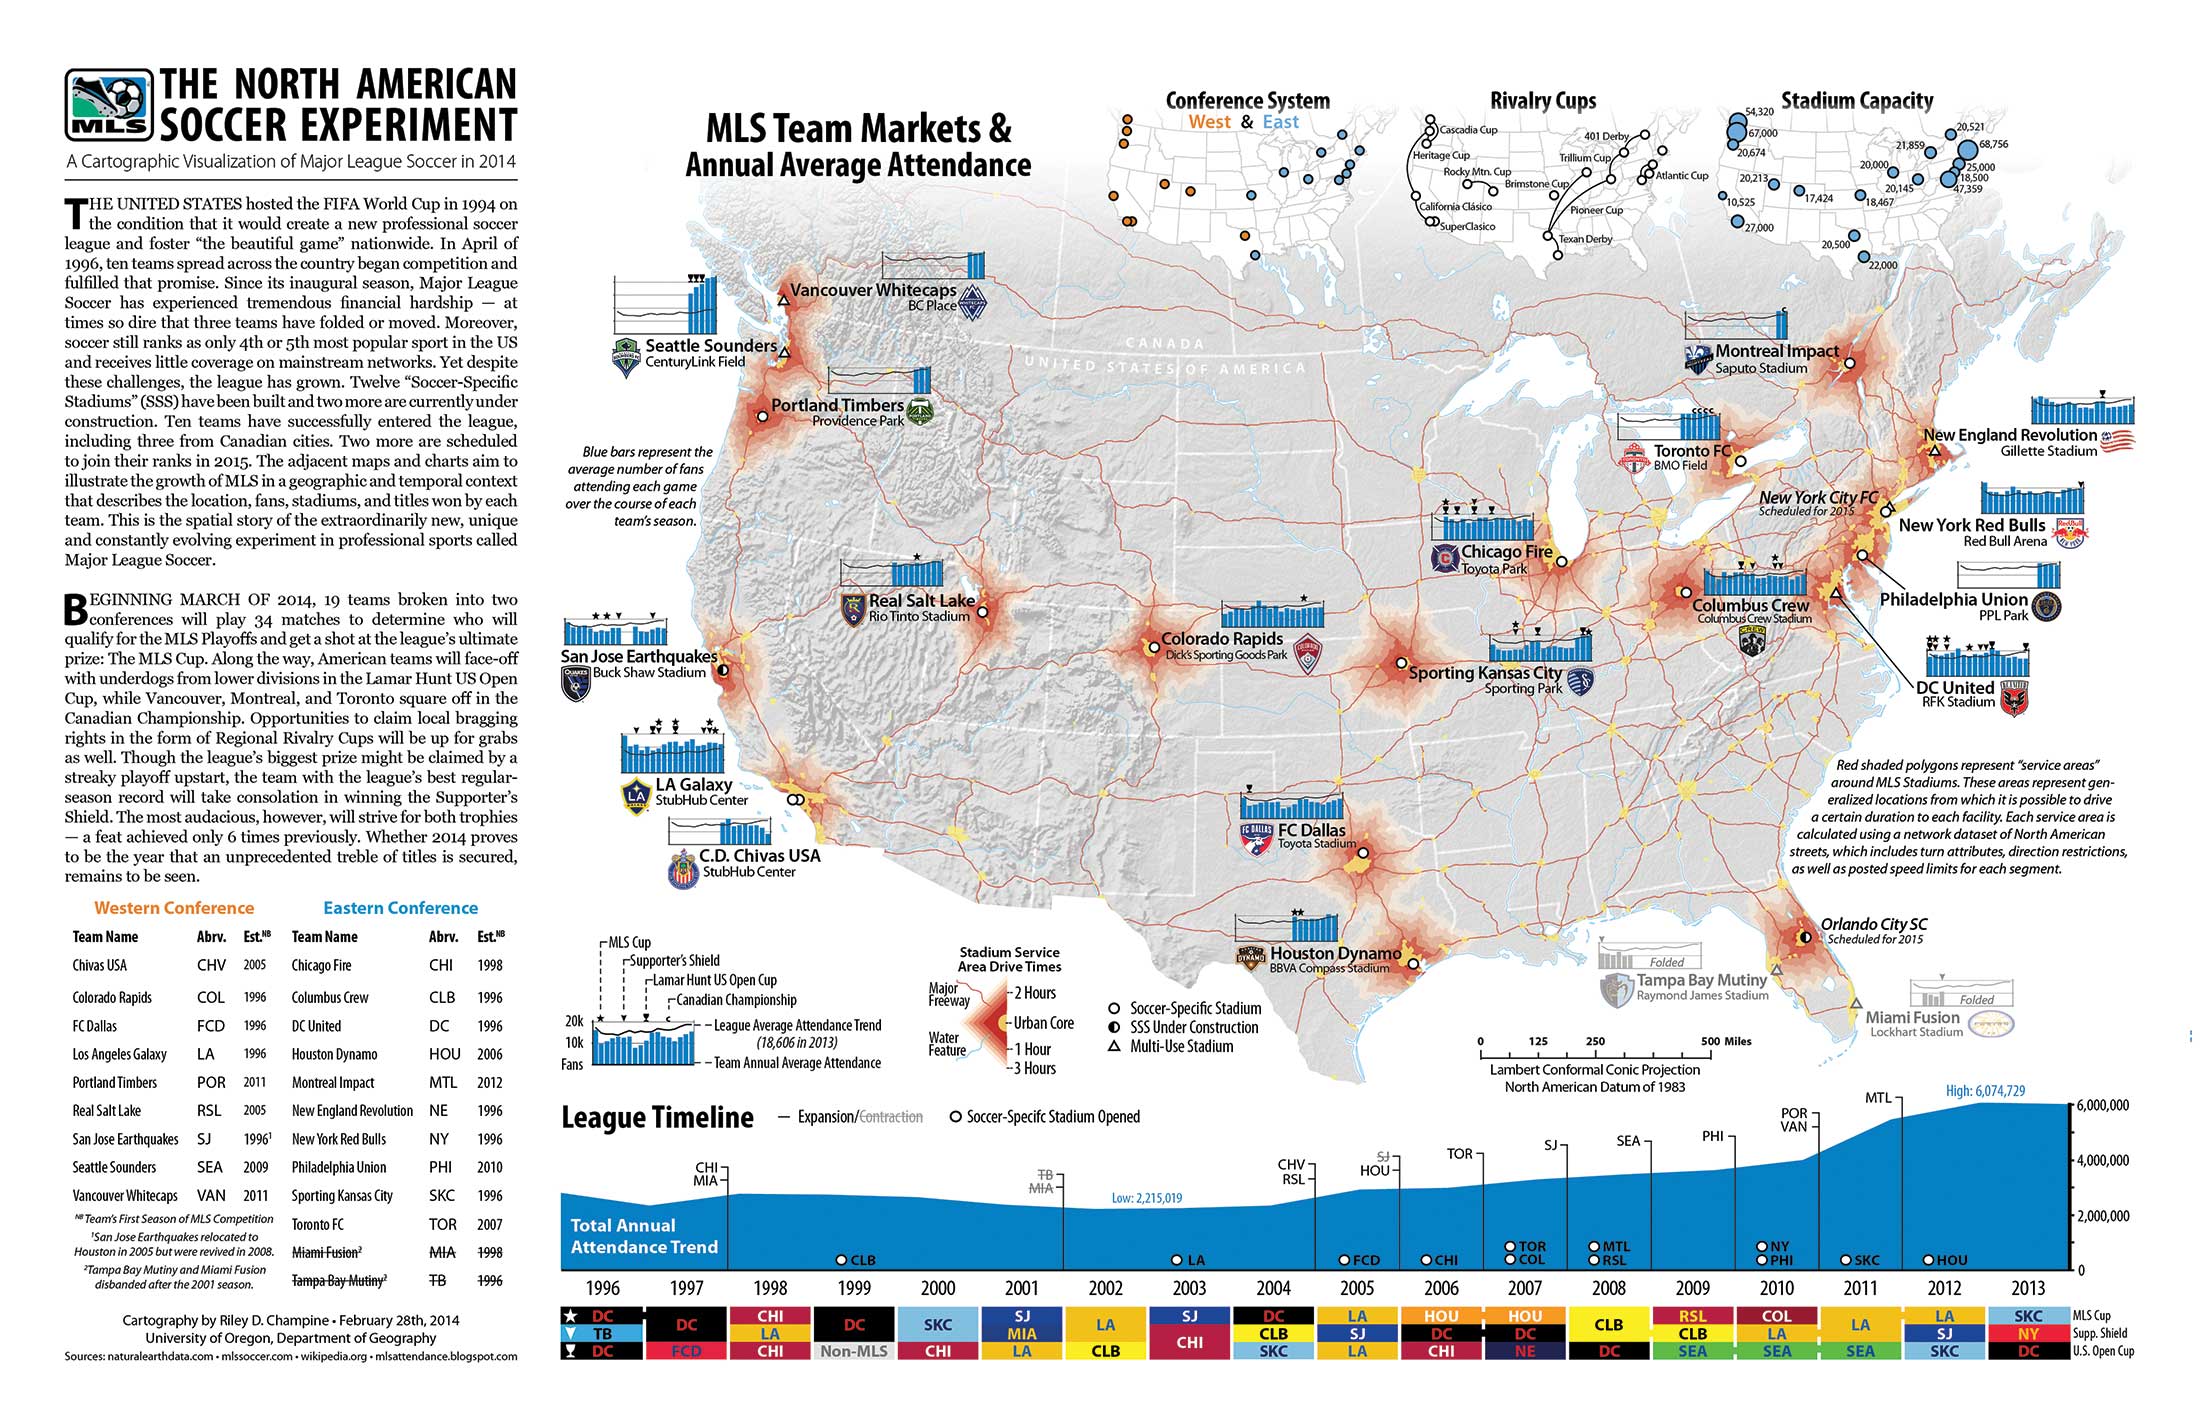
The course was Advanced Cartography. Instructor James Meacham assigned students to develop an idea for a map that would incorporate all the techniques they were to learn over the 10-week term, including design, data sourcing and how to present geographic information visually. Above all else, Meacham said, the map should tell a story.
 Champine (right), a former player and current referee of “the beautiful game,” created a map covering the history of professional soccer in the United States, complete with each team’s attendance, reach and stadium details. It’s an understatement to say he scored. “A Cartographic Visualization of Major League Soccer in 2014” won first place this year in the National Geographic Award in Mapping competition, earning Champine $900 and a world atlas.
Although he came to the UO to study journalism, everything changed for Champine when he took a geography class for a general-education requirement; it included a weekly two-hour lab, which enabled Champine to immediately put into practice all that he was learning from lectures. “We were producing maps right off the bat, and that really surprised me,” he said. “That’s what’s cool about the lab setup—you learn the software and technology through your own trial and error.”
Tell me a story
Champine was quickly hooked on the same idea that Meacham would later emphasize in the upper-level course: Maps should tell stories, bringing together reams of data from various sources, gleaning the crucial information and presenting it in a way that is clear and compelling, even aesthetically pleasing.
“Looking at a database or an Excel spreadsheet is probably the furthest thing you can think of from storytelling—it’s raw, it’s boring,” Champine said. “But maps are about telling and showing. When you make a map, you make that raw information much more intriguing.”
Now a senior majoring in geography and planning, Champine set about his soccer map with the passion of a true fan of the game. Key to his success was the geography department’s InfoGraphics Lab.
Under Meacham’s guidance as executive director, the lab completes projects for faculty members, campus offices and government agencies. Those projects range from the routine—say, up-to-date maps of campus—to the exquisite. The lab in 2012 created the Atlas of Yellowstone, the first-ever of a U.S. national park and a state-of-the-art reference volume that has received national acclaim.
The lab—which offers students paid positions and work space for projects—provides training in geospatial technologies, a heady term for today’s advanced mapping used in business, education and government.
From restaurant reviews to disaster relief
Geospatial technologies are a booming field in geography. The combination of mobile devices, the Internet and global positioning systems—read: satellites—is enabling anyone, anywhere, to send and receive unprecedented amounts of data about physical locations. It’s using your smartphone, for example, to read restaurant reviews simply by holding the phone up at a street corner and scanning the neighboring eateries; it’s also the real-time mapping of victim locations, services and open roads during a disaster.
This geospatial revolution is changing how mapping and other forms of geographic research are done; it’s also creating a wave of new jobs and products.
Most universities serve students’ interests in one of those areas—research, job training or technology development—but the UO caters to all three, said Ken Kato, associate director of the lab.
“Students know they want to work with mobile technology and geospatial data—what blows their minds is what can be done with it,” Kato said. “We blur the lines between research, education and technology so students find what’s right for them.”
(Check out the infographics-related careers that Ducks in geography have landed.)
Champine’s soccer map is a perfect example: What started out as a classroom assignment became a research project—his map draws from existing data to create new knowledge about the history of the league, Meacham said.
Working around the clock
As the project deadline approached, Champine found himself working nearly nonstop on the map, even tinkering with details while listening to lectures in other classes. He and Meacham met weekly; the two went back and forth over how much information to include, with Champine’s hunger for statistics eventually yielding to Meacham’s push for an end product that is clean and inviting.
Champine also put drafts of the map in front of his classmates, collecting not just favorable reviews but plenty of insightful criticism. That’s a real strength of the geography department, he said—the culture is “positive and collaborative,” with faculty members and students pulling together, lifting not just a particular individual but everyone in the department.
That’s no accident. The department practices “collaborative learning,” Meacham said, because cartographers don’t work in a vacuum; students must get comfortable with the consensus-building they’ll do as professional mapmakers, working with statisticians, planners, engineers, managers, historians and even the general public.
“Mapping projects always involve teams of experts from different areas,” Meacham said. “Very seldom do you get a cartographer just doing their own thing.”
—Matt Cooper
Photo of Champine: Tim Christie